
"Our solid integrated performance in 2016 shows once again our capacity to create lasting value for all of our stakeholders."
Chairman and Chief Executive Officer
CSR | 09.02.2026
Legrand once again ranked among the top-performing companies in CSR by EcoVadis
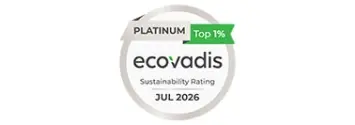
In July 2026, Legrand once again received the EcoVadis Platinum medal, the highest level of recognition granted by EcoVadis, confirming its position among the top 1% of companies for CSR performance.
Legrand’s solid 2016 integrated performance demonstrated once again the Group’s capacity to create lasting value for all of its stakeholders.
€5.0 billion
of sales in 2016
29%
of 2016 sales came from the North and Central America region
33%
of 2016 sales came from new business segments(1)
(1)New business segments include energy efficiency, digital infrastructures, assisted living and home systems.
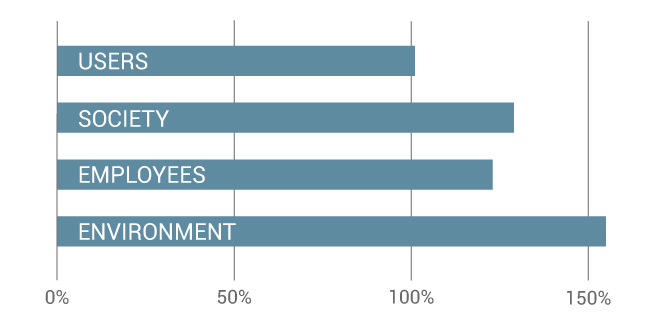
Average achievement of CSR targets at year-end 2016(1)
122 %
(1)CSR roadmap 2014-2018
Present in over 90 countries
Products sold in nearly 180 countries
Nearly 36,000 employees
Over 90 product families
| Category | Value |
|---|---|
| 2014 | 4499 |
| 2015 | 4810 |
| 2016 | 5019 |
*Operating profit adjusted for amortization and depreciation of revaluation of assets at the time of acquisitions and for other P&L impacts relating to acquisitions and, where applicable, for impairment of goodwill.
| Category | Value |
|---|---|
| 2014 | 880 |
| 2015 | 930 |
| 2016 | 979 |
| Category | Value |
|---|---|
| France | 17.4 % |
| Italie | 9.8 % |
| Reste de l'Europe | 17.4 % |
| Amérique du Nord et Centrale | 29.2 % |
| Reste du monde | 26.2 % |
€567M in 2016*
*Adjusted for the favorable non-recurring accounting impact representing a €61.2 million tax income, coming from the announcement of reductions in the corporate income tax rates, mainly in France. This tax income is adjusted as it has no cash impact, and bears no relationship to the Group’s performance. The reported net income excluding minority interests is €628.5 million.
| Category | Value |
|---|---|
| 2014 | 532 |
| 2015 | 551 |
| 2016 | 567 |
| Category | Value |
|---|---|
| 2014 | 607 |
| 2015 | 666 |
| 2016 | 673 |
| CSR INDICATORS Progress on 2014-2018 CSR roadmap (achievement rates for 2016 targets) |
|
 |
% of sales representing products with a PEP, Product Environmental Profile
| Category | Value |
|---|---|
| 2014 | 52 |
| 2015 | 56 |
| 2016 | 60 |
Total number of people directly or indirectly affected by Electricians Without Borders projects backed by Legrand since 2007
| Category | Value |
|---|---|
| 2014 | 1.3 |
| 2015 | 1.6 |
| 2016 | 1.8 |
| Category | Value |
|---|---|
| 2014 | 86 |
| 2015 | 87 |
| 2016 | 88 |
Number of accidents x 1 000 000/number of hours worked
| Category | Value |
|---|---|
| 2014 | 7.25 |
| 2015 | 5.9 |
| 2016 | 5.3 |
1.19 € in 2016*
*Subject to approval by shareholders at the General Meeting on May 31, 2017.
| Category | Value |
|---|---|
| 2014 | 1.1 |
| 2015 | 1.15 |
| 2016 | 1.19 |
1.10€
dividend per share in 2016
56%
Payout rate in 2016
Share ownership structure at February 28, 2017:
- Management and staff (1): 4%
- Free float: 96%
(1)Current and former senior and main managers, and employees.
Chairman and Chief Executive Officer